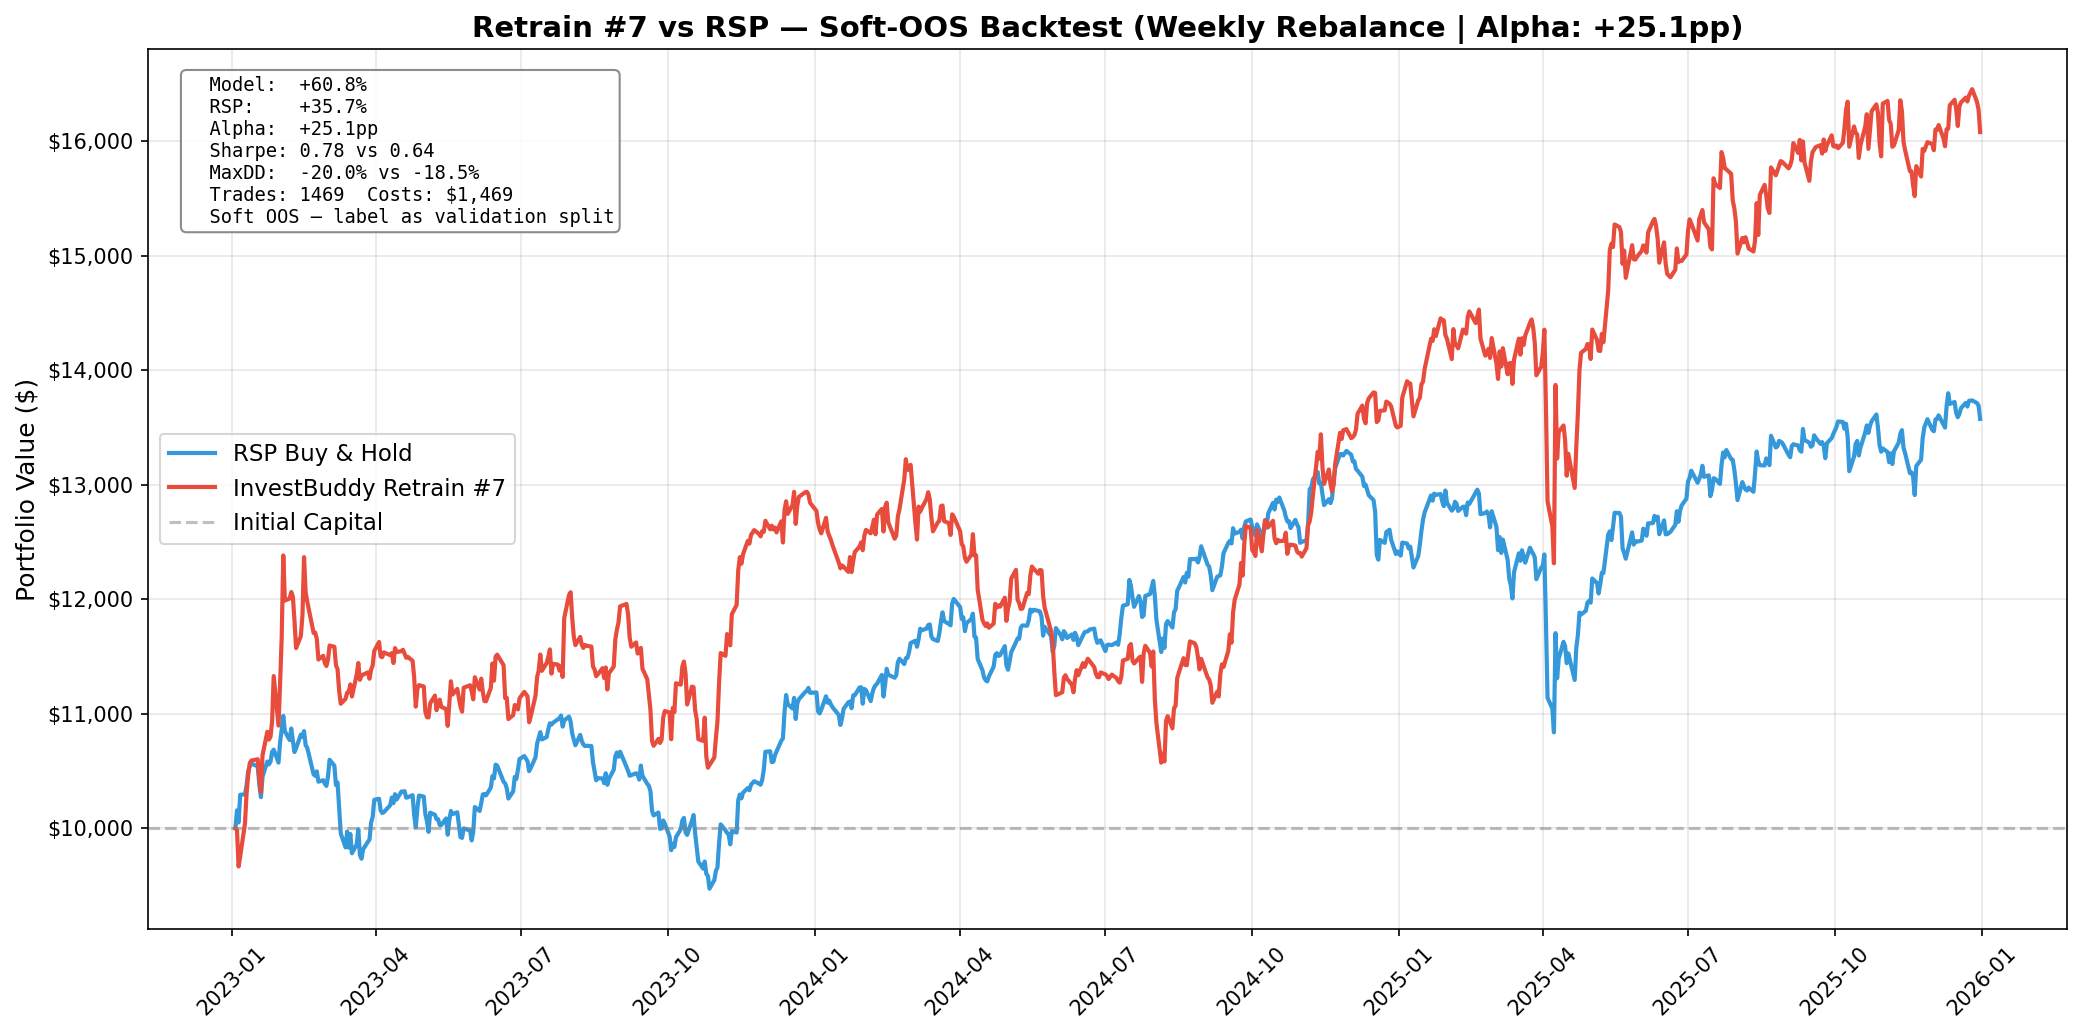
How InvestBuddy Compares to Major ETFs
Retrain #7 architecture vs RSP equal-weight benchmark · Phase 2 comprehensive multi-ETF analysis (2022–2025)
* Soft-OOS Validation Split (Jan 2023 – Dec 2025). Model trained through May 3, 2026 — this backtest predates the training cutoff and represents validation-split quality, not hard out-of-sample performance. Hard OOS live-market validation scheduled Q4 2026. RSP was chosen as the benchmark because equal-weight vs equal-weight is the structurally honest comparison for a 10-stock portfolio.
Phase 2 Monthly Performance Comparison (2022–2025)
Phase 2 backtest: $10,000 across 0 snapshots rebalanced every 30 trading days. Phase 3 (Retrain #7) uses weekly rebalancing — see the Phase 3 section above.
📊 Understanding "Alpha" (Excess Return)
Alpha Formula:
✅ Example: Your Data
• InvestBuddy: +58.70%
• VOO (S&P 500): +42.77%
• Alpha: 58.70% - 42.77% = +15.93%
📈 What This Means:
Final values ($10K start):
• InvestBuddy: $15,870.00
• VOO: $14,277.00
InvestBuddy earned you $1,593.00 more
How to Read This Table
📊 Starting Point: Each strategy started with the same $10,000 investment on
📅 Rebalancing: Portfolio reviewed every 30 trading days (≈42-45 calendar days due to weekends/holidays)
⚠️ Note: Dates aren't exactly 30 days apart because the backtest uses trading days only. 30 trading days ≈ 6 weeks calendar time.
🎯 The Top 5 Rotation: The LSTM model continuously ranks a 50-stock universe by predicted momentum. At each 30-day interval, the AI liquidates any holding that has fallen out of the Top 5 — that's the implicit SELL signal — and reallocates the freed capital equally into the new highest-probability momentum leaders (BUY signal). Each position is sized at exactly 1/5 of total portfolio value. If the entire market turns negative, the model issues an absolute SELL and rotates the full portfolio to cash.
💎 Transparency: Every pick shown is verifiable — paste the tickers and date into any charting platform to independently confirm the backtest results.
💸 Transaction Costs: InvestBuddy results include realistic friction: $1.00 flat fee per trade + 0.05% slippage per transaction. ETF benchmarks (VOO, RSP, QQQ, 60/40) assume $0 commission — making InvestBuddy's outperformance more conservative.
💡 Toggle Benchmarks: Click "Show Institutional Benchmarks" to reveal RSP (Equal Weight), QQQ (Nasdaq-100), and 60/40 Portfolio columns
🔄 Phase 2: How Monthly Rebalancing Works in Practice
This Phase 2 dataset uses a 30-day rebalance cadence (aligned to the Phase 2 model's 10-day prediction horizon). Phase 3 (Retrain #7) switches to weekly rebalancing because the model's primary signal is now day-5, making 5 trading days the structurally correct hold period.
Here is how a user executes the Phase 2 monthly AI output:
The Hold
If a stock (like CVX) was in your portfolio last month and the AI keeps it in the Top 5 this month, you do nothing. You simply hold it.
The Implicit Sell
If a stock loses its momentum and drops out of the Top 5, that is your sell signal. You liquidate that specific position.
The Buy
You take the cash from your sold positions and buy the new stocks that just entered the Top 5, restoring your equal-weight balance.
📋 Note: Our backtest math assumes a worst-case scenario (100% portfolio turnover every 30 days) to ensure our $21.68 fee penalty is as aggressive as possible. In reality, because the AI often holds winning stocks for multiple months, your actual transaction friction will be lower.
📚 Understanding Each Benchmark
📈 S&P 500 ETF (VOO)
What it measures: Market-cap weighted performance of the 500 largest US companies
Goal: Track the broad US stock market benchmark used by institutional investors
Analysis: If InvestBuddy's alpha is positive, it means AI stock selection beat the passive market approach
⚖️ Equal Weight ETF (RSP)
What it measures: S&P 500 companies with equal allocation (no big-cap bias)
Goal: Test if AI selection beats democratized portfolio weighting
Analysis: Large alpha shows AI picks higher-quality stocks vs spreading capital equally
💻 Nasdaq-100 ETF (QQQ)
What it measures: Top 100 non-financial Nasdaq stocks (tech-heavy)
Goal: Compare AI sector rotation vs pure tech momentum strategy
Analysis: Positive alpha proves intelligent diversification beats tech concentration
🛡️ 60/40 Portfolio
What it measures: Traditional balanced portfolio (60% stocks/VOO, 40% bonds/AGG)
Goal: Test AI cash fallback vs traditional bond protection
Analysis: Large alpha shows cash-based risk management outperforms fixed income drag
Final Returns
Test Period
What This Proves (Phase 2)
- Phase 2 (monthly rebalancing, 2022–2025) beat equal-weight RSP by +87.39pp
- Phase 3 Retrain #7 (hysteresis, 2023–2025) beat RSP by +25.05pp at 0.78 Sharpe
- 47k-parameter model (67% leaner) eliminates Epoch 1 memorization, forces genuine generalization
Phase 3 Architecture Update (May 2026)
New pipeline with persistence hysteresis, tested against RSP — the harder equal-weight benchmark
Five Structural Fixes That Unlocked This
- 🔄 Persistence Hysteresis — hold winners until signal actually dies
- 📊 Confidence threshold raised 15% → 25%
- 🚫 $5 price floor — blocks penny-trap microstructure
- 📅 7-day earnings blackout — avoids binary event risk
- ⚡ Head-conflict gate — direction vs magnitude must agree
⚠️ Soft OOS Disclosure
Model trained through May 2026. This 2023–2025 window predates the training cutoff (validation-split quality). Hard OOS test runs September 2026.
"The $5 price floor kept you out of the graveyard, and the hysteresis let your ML edge actually manifest as dollars. When you run this exact same script in September for the Hard OOS window, if the red line is still above the blue line, you are ready to deploy real capital."
Phase 2: Why Monthly Beat Weekly
In Phase 2 (10-day prediction model), the math was unambiguous — monthly rebalancing dominated. Phase 3 changed the architecture and the correct cadence with it.
| Metric | Monthly (30 days) | Weekly (7 days) | Impact |
|---|---|---|---|
| 🏆 Sharpe Ratio | 0.95 | 0.46 | Monthly +0.49 better risk-adjusted ✓ |
| Transaction Costs | $533 | $1,224 | Weekly costs +$691 (+130%) |
| Cost as % of Capital | 5.33% | 12.24% | +6.91% more friction |
| Number of Trades | 241 | 573 | Weekly +332 trades (+138%) |
| Max Drawdown | -37.51% | -37.63% | −0.12% (similar depth) |
| Total Return | +106.12% | +117.33% | Weekly +11.21% higher |
| Final Value | $20,612.38 | $21,732.68 | Weekly +$1,120 (+5.4%) |
| Alpha vs VOO | +63.41pp | +73.51pp | Weekly +10.10pp higher |
| Alpha vs QQQ | +53.36pp | +63.12pp | Weekly +9.76pp higher |
The Physics of the Sharpe Collapse
Weekly sampling captures the chaotic high-frequency noise of daily price swings. Monthly sampling smooths that noise into a measurable trend. The result: Sharpe 0.95 → 0.46 — you take on more than double the volatility for only +$1,120 in extra return. In institutional finance, 0.95 on a long-only strategy is elite. 0.46 is marginal.
Phase 2: The 10/7 Timing Mismatch
The Phase 2 LSTM predicted a 10-day forward horizon. Weekly rebalancing forced an exit every 7 days — three days before momentum was expected to materialize. Phase 3 Retrain #7 changed this: the primary signal is now day-5, so 5 trading days (weekly) is the structurally correct hold period — no mismatch.
Phase 3: Architecture-Driven Cadence
Phase 3 Retrain #7 uses persistence hysteresis: positions are held until their own signal dies, not until a calendar date. When no signal dies, zero trades happen — cost stays near zero. When stocks rotate out, you trade. This means Phase 3 can use weekly as the check frequency without incurring the full weekly cost burden. The cadence follows the signal, not a schedule.
Phase 2's model survived a 12.24% capital drag from weekly friction and still dominated the S&P 500 by +73.51pp — confirming genuine, persistent signal. But the higher Sharpe (0.95 vs 0.46) at monthly frequency made monthly the right choice for Phase 2's 10-day prediction window.
The Brutal Friction of Overtrading
Every single rebalance costs the same ~$21.68 in combined commissions + slippage. See how trading 4× more often drains your capital and destroys your risk-adjusted efficiency.
⚗️ Cost Per Rebalance (5-stock portfolio, avg ~$11,700)
✖️ The Multiplier Effect (Walk-Forward Period: 2022 – 2025)
The Math Is Unavoidable
Phase 2's AI signal is so strong that weekly trading still outperforms the S&P 500 — but look at the cost. To chase an extra 11% in raw returns, you have to pay 130% more in broker fees, execute 332 extra trades, and cut your risk-adjusted Sharpe Ratio in half. We optimized InvestBuddy for your peace of mind, not your broker's commission quota.
Sharpe penalty = 0.95 → 0.46 = −0.49 risk-adjusted cost ← frequency tax
Fee assumptions: $1.00 flat commission per trade (any U.S. broker) + 0.05% slippage per execution side. Applies to sell + buy legs at every rebalance. ETF benchmarks (VOO, QQQ, RSP, 60/40) assume zero transaction costs — a conservative assumption that actually disadvantages InvestBuddy.
⚠️ Important Disclaimer
Not Financial Advice: InvestBuddy provides quantitative data, analysis, and AI-driven model portfolios for informational and educational purposes only. Nothing on this page constitutes personalized investment advice, a recommendation to buy or sell securities, or an offer to provide advisory services.
Past Performance Disclaimer: Historical backtest results are hypothetical and do not guarantee future performance. The benchmark comparisons shown (2022-2025) represent simulated performance calculated using historical data. Actual results will differ due to market conditions, timing, execution costs, and individual circumstances.
Historical Simulation Notice: This is a historical simulation, not a true out-of-sample forward test. The model's parameters were trained on data that partially overlaps with the 2023–2025 portion of the simulation period. The 2022 period (where InvestBuddy fell harder than VOO, reaching –29% by May 2022) reflects genuine out-of-distribution model behavior. True forward testing from March 2026 is ongoing.
Concentration Risk Disclosure: InvestBuddy holds 5 stocks vs. VOO's ~500. A Monte Carlo analysis (1,000 random 5-stock portfolios, same period and universe) showed the median random portfolio returned +50.72% — meaning concentration alone adds approximately +8pp over VOO before any AI selection. InvestBuddy's +106.12% sits at the 77.7th percentile of random portfolios, reflecting real but moderate model edge. ~1 in 4 random portfolios achieved similar or better returns.
Risk Disclosure: All investing carries risk of loss, including loss of principal. Stocks and equity-based strategies are subject to market volatility. The maximum drawdown shown (–37.51% for InvestBuddy) represents a significant temporary loss that occurred during the test period. Future drawdowns may be larger.
Methodology Note: Transaction costs ($1/trade + 0.05% slippage) are included in all InvestBuddy results. ETF benchmarks assume zero transaction costs for maximum comparability. The September 2025 portfolio gain (+21.1% in 6 weeks, driven by MU +55% and UNH +36%) was independently audited against live Twelve Data prices and confirmed as a genuine market move with no data artifacts.
Consult a Professional: Before making investment decisions, consult a licensed financial advisor who understands your unique financial situation, goals, risk tolerance, and tax circumstances.
Research Attribution: Analysis prepared by InvestBuddy Research Team | Phase 3 Retrain #7: May 12, 2026 | Phase 2 Comprehensive: March 11, 2026 | Terms of Service | Privacy Policy