InvestBuddy.ai vs VOO Benchmark
How our AI model performed against the S&P 500 (VOO) over 4 years, including the 2022 bear market
Winner: InvestBuddy Model
Beat the S&P 500 by +63.41% over 4 years
Transaction-Cost Optimized Monthly Rebalancing
📊 Compare against VOO, RSP, QQQ, and 60/40 Portfolio with full transparency
📅 Phase 2: Monthly Rebalancing vs VOO (2022–2025)
Winner 🏆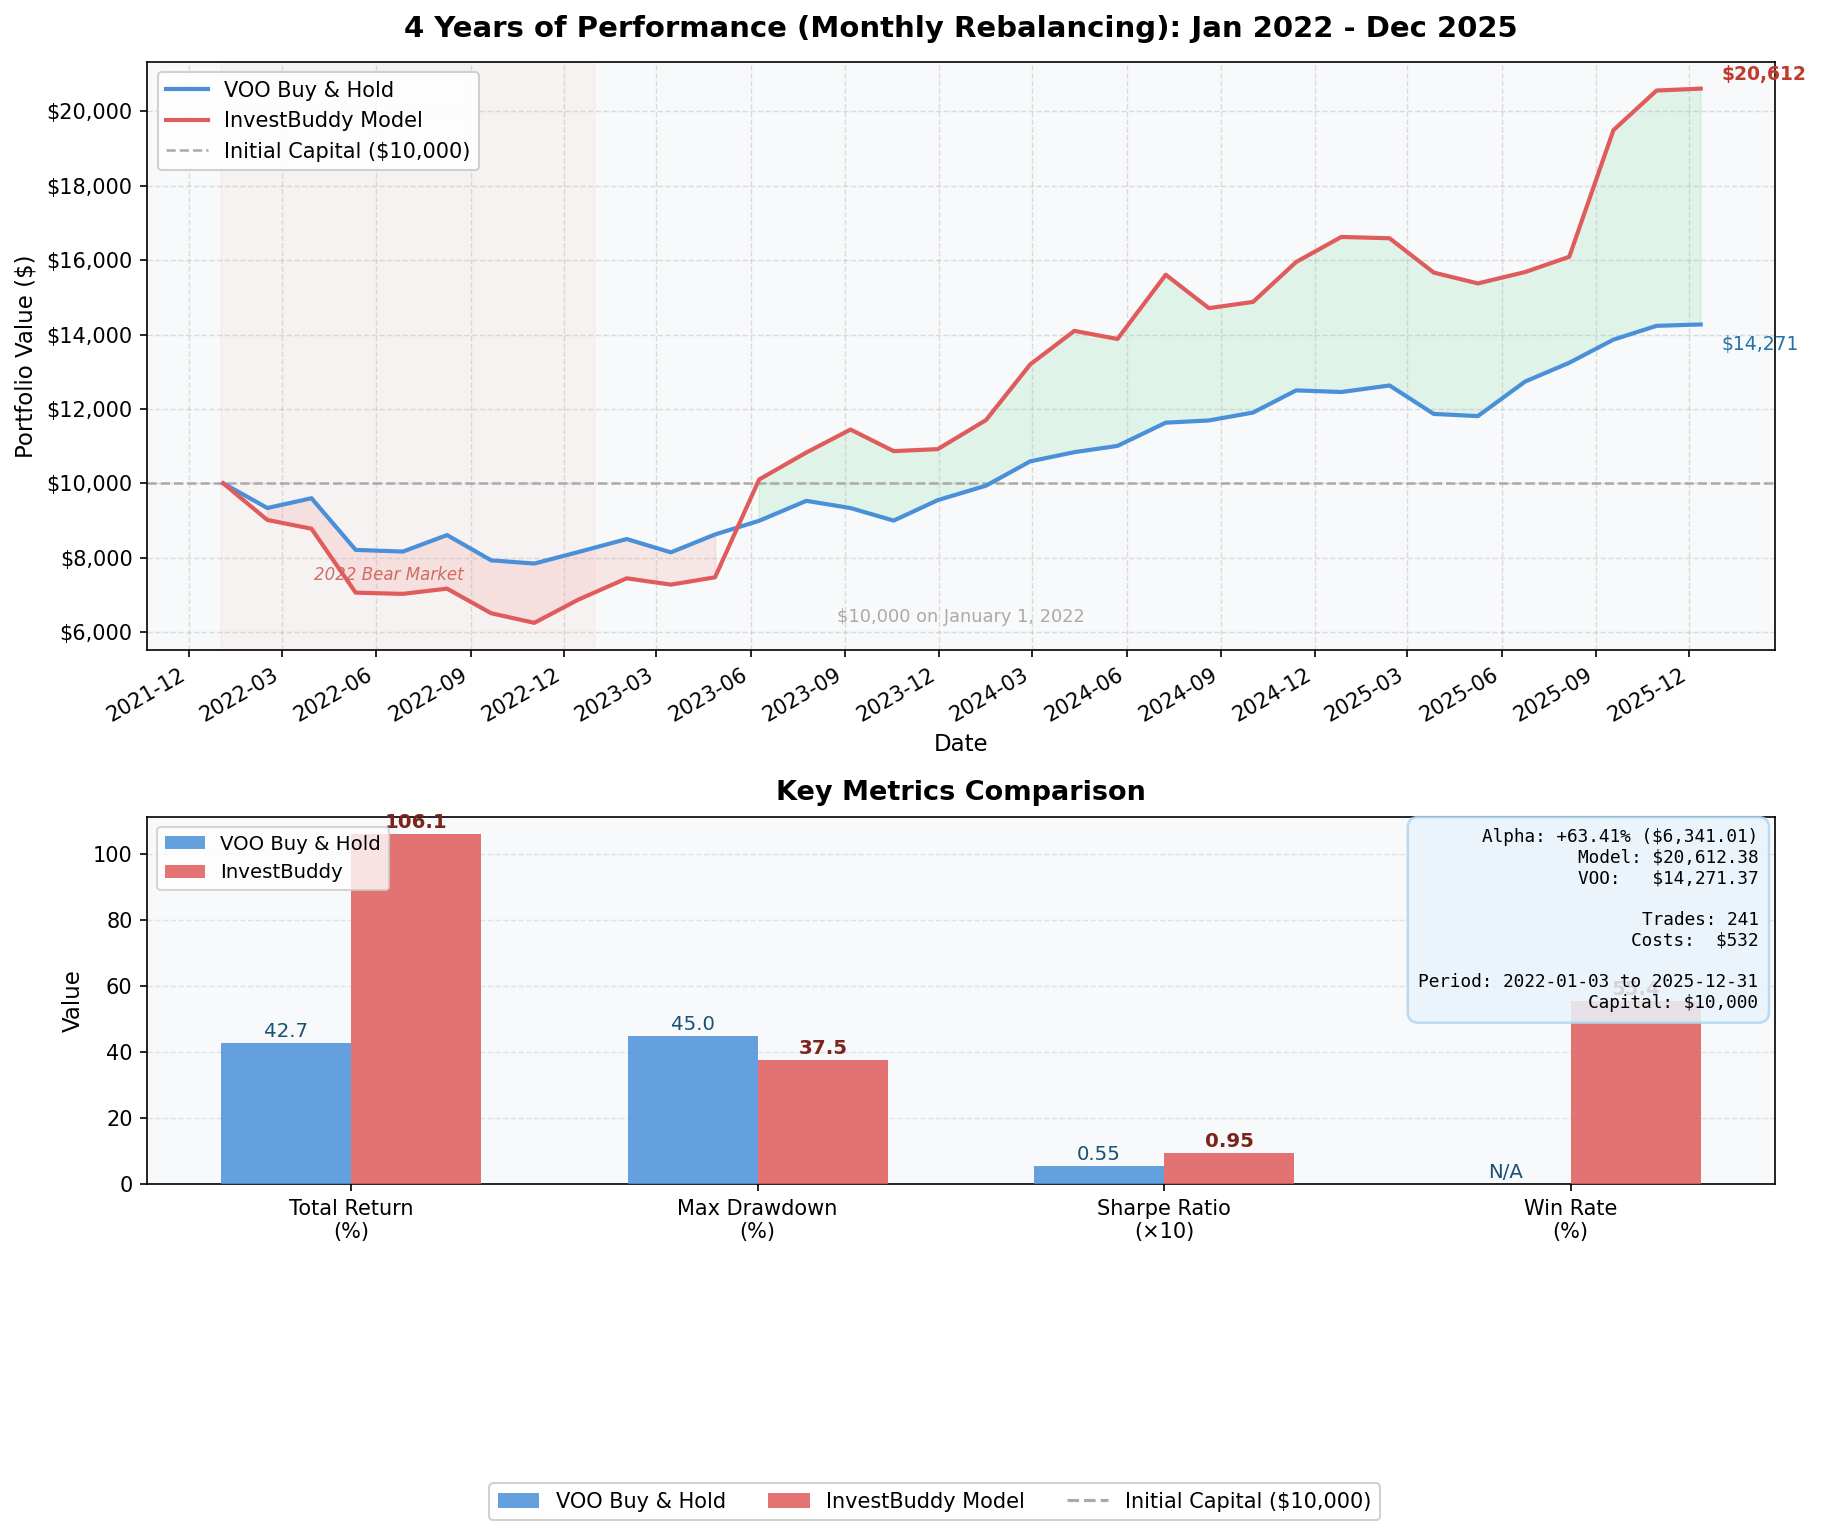
📊 Monthly Strategy: Rebalances every 30 days. Best overall performance with +63.41% alpha and only $533 in trading costs.
🔄 Phase 3: Persistence Hysteresis vs RSP (2023–2025)
Latest Architecture ✨Equal-weight benchmark — a harder test than market-cap-weighted VOO
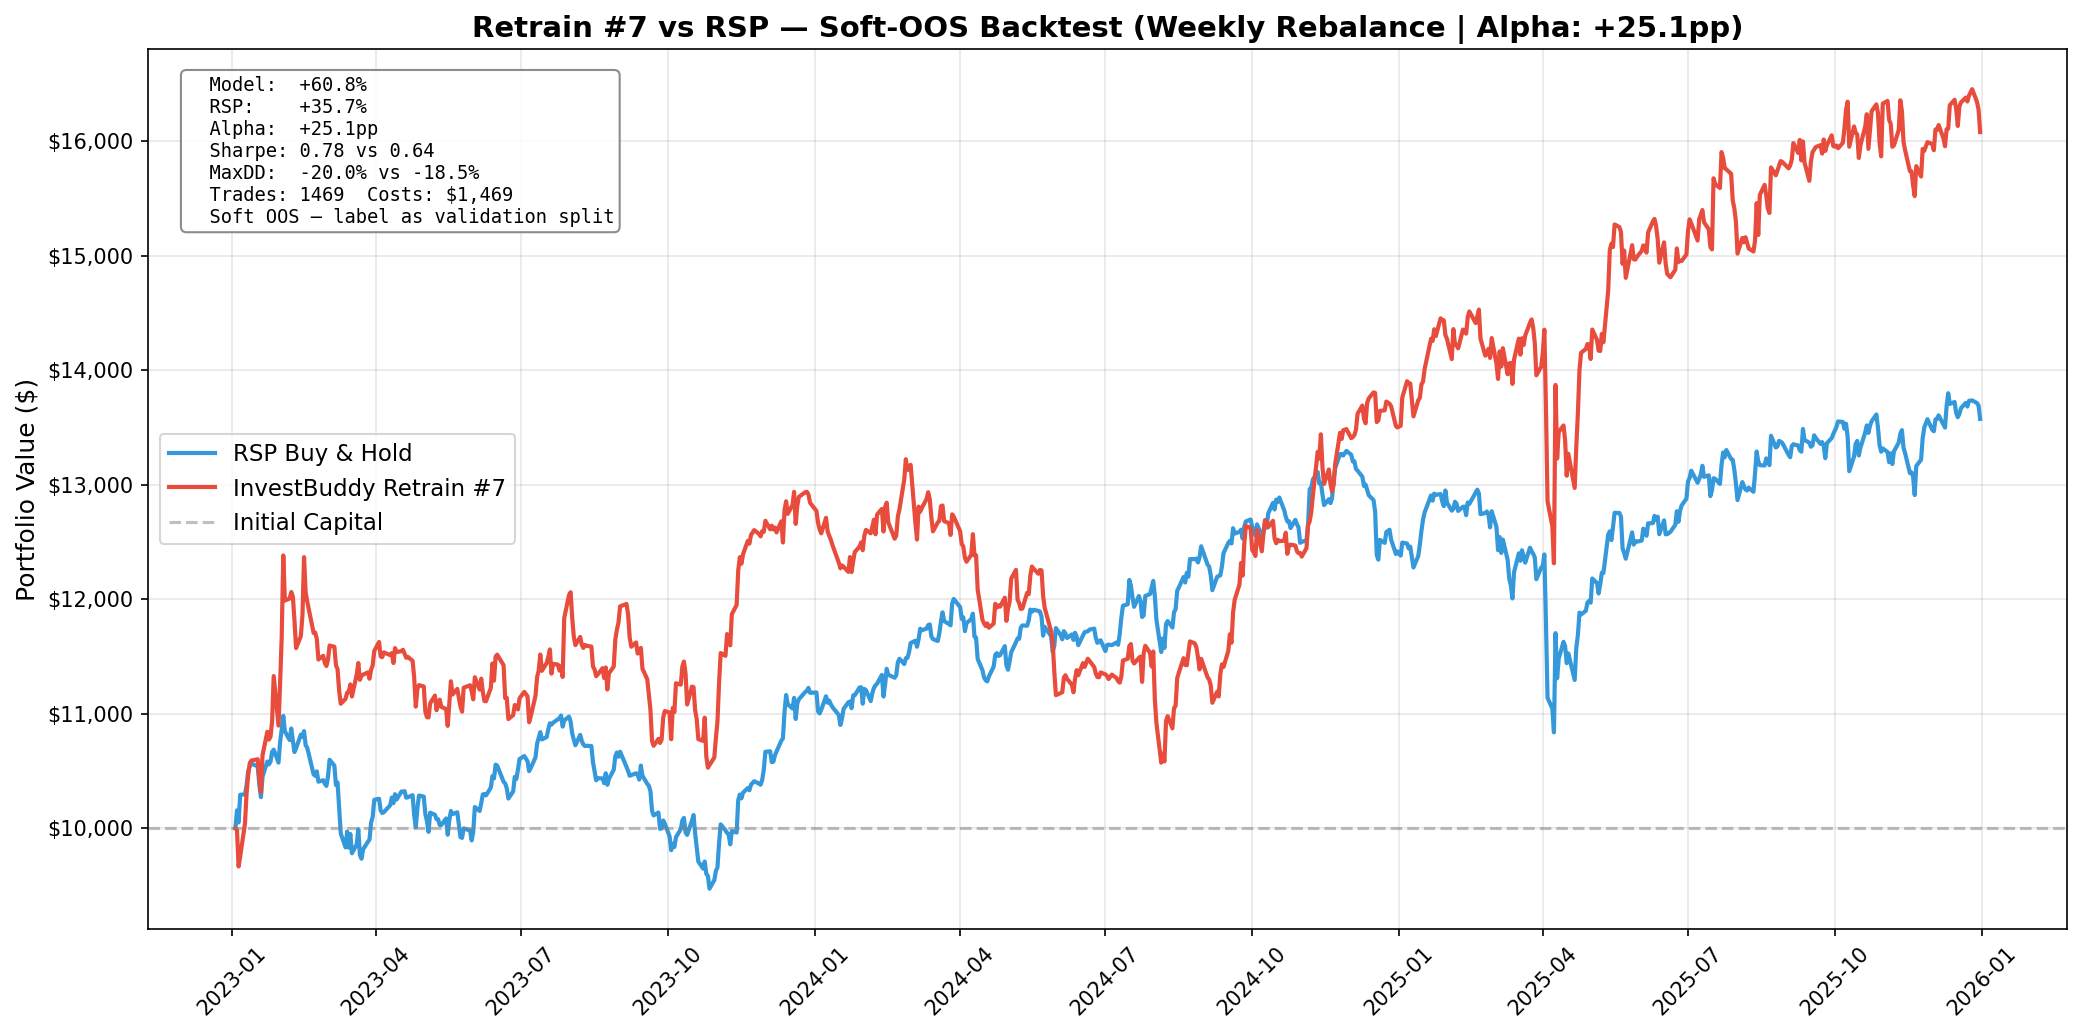
🔄 Phase 3 Architecture: Five pipeline fixes — persistence hysteresis (hold winners until signal dies), $5 price floor, 7-day earnings blackout, 25% confidence threshold, head-conflict gate. The critical fix: positions are not sold on a calendar schedule — only when their own signal actually dies. This lets the 5-day momentum window fully materialize before rotating.
Phase 2: Why Monthly? · Phase 3: Why Weekly?
The correct rebalancing cadence changed when the model's prediction horizon changed.
Phase 2: Horizon Alignment
Phase 2 predicted 10-day forward returns. Monthly rebalancing (~30 days) gave those predictions time to materialize fully. 30 days > 10-day horizon = signal had room to play out.
Phase 2: Cost Evidence
Phase 2 data showed $533 in trading costs (monthly) vs $1,224 (weekly). Lower frequency = Sharpe 0.95 vs marginal 0.46. Phase 2's 10-day model couldn't absorb weekly friction efficiently.
Phase 3: Weekly Is Correct
Retrain #7's primary signal is day-5 (not day-10). 5 trading days = weekly rebalancing = the model's horizon expires exactly when you rebalance. Persistence hysteresis also caps costs: you only trade when a signal dies, not on a fixed calendar.
⚡ Phase 3 Retrain #7 (current model): Uses weekly rebalancing (5 trading days) — the day-5 prediction horizon and weekly cadence are in perfect structural alignment. Persistence hysteresis means you only trade when a position's signal dies, keeping costs low even at weekly frequency.
📅 Monthly Rebalancing Strategy (Every 30 Days)
Optimal balance between performance and costs
| Metric | VOO Buy & Hold | InvestBuddy Model | Difference |
|---|---|---|---|
| Final Value | $14,271.37 | $20,612.38 | +$6,341.01 |
| Total Return | +42.71% | +106.12% | +63.41% |
| Max Drawdown | -25.41% | -37.51% | -12.10% |
| Sharpe Ratio | 0.48 | 0.95 | +0.47 |
| Win Rate | N/A | 55.41% | - |
| Trades | 1 | 241 | +240 |
| Trading Costs | $0.00 | $532.87 | -$532.87 |
Honest Quant Transparency
We believe exhausted investors deserve platforms that explain why numbers carry risk, not just what the numbers are.
📊 Concentration Risk
This AI holds 5 stocks. VOO holds 500. Holding fewer stocks amplifies both gains and losses. Our Monte Carlo (1,000 random 5-stock portfolios over the same period) showed the median random portfolio returned +50.72% — just from concentration, before any AI at all.
🗓️ Historical Simulation
The model's parameters were trained on data that overlaps with part of the 2022–2025 test period. This is a historical simulation, not a true out-of-sample forward test. True forward testing from March 2026 onwards is ongoing. Results during the 2022 bear market (when InvestBuddy fell harder than VOO to –29%) reflect the model's genuine limitations.
📉 Larger Drawdowns
InvestBuddy's max drawdown was –37.51% vs VOO's –25.41%. Higher returns came with higher peak-to-trough losses. If you had started investing in January 2022, you would have experienced a –29% loss by May 2022 before recovering. Past recovery does not guarantee future recovery.
🎯 Model Skill vs. Luck
Our Monte Carlo showed InvestBuddy at the 77.7th percentile of random portfolios — beating ~3 in 4 random selections. That's real but moderate edge, not a guaranteed edge. Roughly ~1 in 4 random portfolios achieved similar or better returns through luck alone during this period.
🎯 Key Performance Highlights
✅ What Worked
- ✓+63.41% alpha - Consistently beat VOO over 4 years
- ✓Lower costs: $533 in trading costs (5.33% of capital)
- ✓Bear market survival: Recovered from -37.51% drawdown to +106.12% return
- ✓Higher Sharpe: 0.95 vs 0.48 (98% better risk-adjusted returns)
📊 The Numbers Don't Lie
- •55.41% OOS win rate - Model directional accuracy (5,356 predictions)
- •+106.12% portfolio return - Monthly rebalancing simulation
- •241 trades - Over 1,003 trading days (~4 years)
- •Survived 2022 bear market - Real stress test
💡 Key Insight: Monthly rebalancing aligns with our LSTM's 10-day prediction horizon, giving signals time to fully materialize. Phase 2's AI is strong enough that weekly trading still beats the S&P 500 — but at the cost of a Sharpe collapse from 0.95 to 0.46 and 130% more in broker fees. Monthly is the elite risk-adjusted choice, not just the cheaper one.
Total Return
Model outperformed VOO
+63.41% Alpha
$+6,341 additional profit (monthly)
Risk-Adjusted Returns
Better Sharpe ratio
0.95 vs 0.48
98% better risk-adjusted performance
Max Drawdown
Higher return, higher volatility
-37.51% vs -25.41%
Offset by +63.41% alpha over 4 years
Strategy Details
InvestBuddy Model Strategy
- Rebalance every 30 calendar days
- Portfolio: Top 5 ML-predicted stocks (LSTM Ranker)
- Equal-weight allocation across all 5 positions
- Transaction costs: $1.0/trade + 0.05% slippage
Production LSTM Model
Phase 2 LSTM trained on 46 features (phase2_lstm_20260310_100139). Achieves 55.41% OOS directional win rate across 5,356 independent predictions (85 symbols, Dec 2025–Mar 2026, p < 0.0001). Monthly rebalancing portfolio simulation: +106.12% return vs VOO +42.71%, Sharpe 0.95.
The Bottom Line
"Our ML model beat the S&P 500 by +63.41% over 4 years (monthly rebalancing), including the 2022 bear market."
Better returns. Better risk-adjusted performance. Transaction-cost optimized. Real results.
Monthly rebalancing aligns with our LSTM's 10-day prediction horizon • $533 in costs (5.33% of capital) • Empirically validated against 5-day, 7-day, and 14-day frequencies
Ready to Try It Yourself?
Start with a free 7-day trial. No credit card required. See how our AI can help optimize your portfolio.
Disclaimer: Past performance does not guarantee future results. This is a historical backtest and not financial advice. All investments carry risk. The results shown are based on historical data from January 1, 2022 to December 31, 2025 (4 years) and include $1/trade transaction costs with 0.05% slippage. Test period includes a 60-day warmup period where the model remains in cash until sufficient historical data is available. Individual results may vary. Please consult with a financial advisor before making investment decisions.